An interactive mapping profile on the Lower Mississippi Alluvial Valley
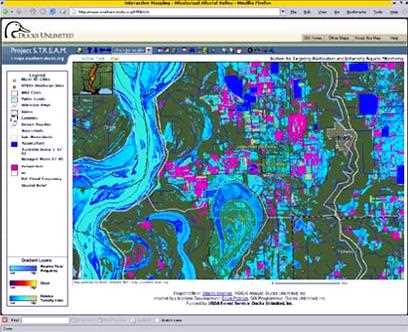
The System for Targeting Restoration and Enhancing Aquatic Monitoring (STREAM) Decision Support System and some of its component datasets as accessible on this page were funded in large part by the USDA Forest Service for the Restoring the Delta Large-scale Watershed Restoration Program.
The information accessible through this system is unsuited for, and shall not be used for, any regulatory purpose of action, nor shall any component thereof be the basis for any determination relating to impact assessment or mitigation. The data contained herein were developed solely for regional conservation planning purposes. Any use of this Information is to be made at the sole risk of the user(s).
Any user who wishes to include results derived from this system in publication or presentation must first acquire consent from Ducks Unlimited and must credit Ducks Unlimited and the USDA Forest Service as the source. For additional information about the system, data, or component projects, please contact us.
The Lower Mississippi Alluvial Valley, the formerly diverse 25-million-acre floodplain ecosystem through which 41% of the conterminous United States drains, exhibits severe water quality impairment, ranging from high turbidity and elevated nutrient loads to high pesticide concentrations, including residual DDT and Toxaphene. In order to advance the LMAV's watershed planning capabilities, Ducks Unlimited developed a web-deployed water quality enhancement Decision Support System (DSS) utilizing Geographic Information System and Remote Sensing technologies. DU utilized satellite imagery to demonstrate a replicable and cost-efficient method to estimate changes in turbidity across water bodies throughout the LMAV. Within the LMAV, turbidity serves as a useful indicator of the presence of sediment-bound pollutants. In addition, DU also developed and compiled a suite of watershed characterization tools to aid in the assessment of conditions within and across watersheds. Water quality planners and project delivery agents can access these powerful geographic analysis tools via an Internet Map Server.
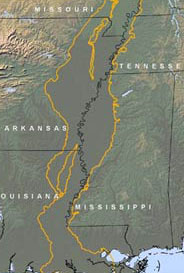
The Lower Mississippi Alluvial Valley, the formerly diverse 25-million acre floodplain ecosystem through which 41% of the conterminous United States drains, exhibits severe water quality impairment. Historically supporting a vast wetland complex of rivers, swamps, sloughs, and floodplain forests that harbored a wealth of biodiversity, today the LMAV ranks as one of the nation's most degraded and biologically impaired ecosystems. This change occurred largely because of wholesale conversion of forests to agricultural lands, as well as associated drainage and flood control projects during the 20th Century (Messina and Conner, 1998; Mitsch and Gosselink, 2000). With approximately 80% of the LMAV currently in agricultural production, the region's waterways exhibit numerous impairments related to agricultural Non-Point Source (NPS) pollutants, ranging from high turbidity and elevated nutrient loads to high pesticide concentrations, including residual DDT and Toxaphene. Public health concerns abound, with fish consumption advisories blanketing much of the region. Furthermore, the five hundred mile long floodplain, along with coastal marshes, serves as a buffer between the nitrogen-loading croplands of the Midwest and the growing zone of hypoxia, or the Dead Zone, in the Gulf of Mexico.In response to the LMAV's ecological impairments, numerous conservation organizations and public health agencies have projects and programs that enhance water quality, and watershed planning efforts are on the rise. Furthermore, reforestation through cost-share programs is driving the conversion of significant acreages of marginal cropland. The reforestation of ecologically sensitive riparian and flood-prone areas holds much potential for mitigating water quality problems via increased nutrient and sediment retention rates and decreased erosion. Between these reforestation efforts and other programs geared specifically toward water quality improvement, the potential exists to significantly impact the quality and health of aquatic systems throughout the LMAV. With support from the USDA Forest Service Restoring the Delta Program, DU developed a web-deployed water quality enhancement Decision Support System (DSS) built upon Geographic Information System and remote sensing technologies. Project STREAM, System for Targeting Restoration and Enhancing Aquatic Monitoring, contains a robust assemblage of watershed planning datasets that will help regional water quality professionals analyze watersheds and determine beneficial sites for water quality enhancement work. These decision support tools, coupled with the Forest Service funded Wetland Restoration Suitability Index, will provide a powerful resource for conservation delivery agents and planners seeking to maximize the ecological benefits of conservation programs. Below the components of STREAM are profiled.
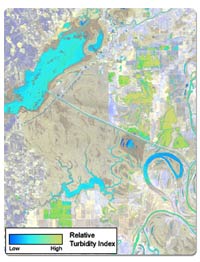 Research shows that infrared and visible spectral reflectance recorded by satellite or aerial sensors can be used to reliably estimate turbidity, particularly as related to suspended sediment loads, with notable accuracy in water bodies of moderate depths (Carpenter and Carpenter, 1983; Ritchie, et al., 1983). By incorporating satellite imagery, performance of uniform suspended sediment monitoring for the 25 million acre LMAV could be realized with significant efficiencies. Such work is critically needed considering the scale of the landscape and the region's remoteness, both of which limit monitoring and leave many waterbodies unevaluated for biological impairment. As a pilot effort, Landsat 5 TM imagery for Path 23 Rows 34-39 and Path 24 Row 36 was acquired for January 17, 2005 (January 24 for Path 24 Row 36). Winter imagery was chosen to minimize the effects of leaf cover limiting visibility of waterbodies and to minimize algal effects on water clarity. The chosen date resulted in predominantly cloud-free coverage of the LMAV. Image processing occurred first by extracting all surface water using a thresholding technique, then the surface water layer was used to mask the original imagery. A turbidity sensitive band ratio, known as the Relative Turbidity Index (RTI), was derived for areas where surface water was observed. The top tercile (amounting to less than .1% of classified pixels) of the RTI values were recoded to facilitate easier discernment of turbidity changes using a color ramp. Sites observed to correspond with the high RTI range can be assumed to carry higher suspended sediment loads than those at lower ranges. Research as cited above suggests accurate turbidity measurements such as Secchi Disk Depth can be estimated from satellite imagery. However, calibrating the satellite-based turbidity estimates to actual on the ground turbidity measurements requires a range of water quality samples. DU was unable to acquire water quality monitoring data for the dates of imagery. Currently, daily turbidity monitoring stations are rare in the LMAV. DU was able to acquire data for only two known stations, and these two had been logging data for less than two years. However, as other monitoring stations come online and additional data streams are made available, the use of satellite-borne sensors to estimate and monitor turbidity seems very promising. The Relative Turbidity Index indicates the potential benefit of these techniques for identifying high-turbidity zones as well as the potential application as a replicable broad-scale monitoring technique. As the RTI currently exists, it can be used within and across waterbodies to identify relative changes in turbidity. Furthermore, by identifying sites or zones of stark RTI value change within a waterbody, planners can isolate likely zones of high sediment loading for further on-the-ground investigation and focusing conservation efforts to sites of greatest benefit.
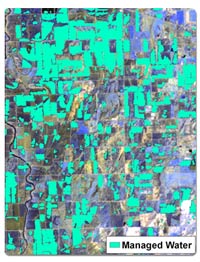
Within the LMAV, a general consensus exists among water quality specialists that one the most cost-effective method for mitigating the agricultural NPS problems of suspended sediment and sediment-bound pollutants is the seasonal flooding of agricultural fields. Research has shown this increasingly common land management practice contributes substantially to sediment retention (Maul and Cooper, 2000; Willis, 2004) Numerous federal, state, and non-profit organizations offer landowners cost-sharing opportunities for installing water control structures, whether for water quality enhancement, waterfowl habitat, or as a post-harvest practice to control erosion. To the great benefit of the water quality community, these practices have proliferated on private lands over the past decade. DU research shows that in recent years the practice of water impoundment rose sharply in the LMAV, with up to 500,000 acres potentially flooded each winter. DU and other agencies track delivery of these water impoundment projects within their respective programs. However, DU landscape level research has identified the existence of hundreds of thousands of acres of water managed outside of any program in the LMAV that go unaccounted for in water quality planning. The spread of this practice, augmented by increasing reforestation of marginal cropland, are important factors influencing water quality in the LMAV. Quantification and spatial distribution analyses of these practices within and perhaps more importantly outside of programs relative to impaired water bodies are essential to planning efforts aimed at determining priority action areas for future projects. These private land conservation practices clearly enhance water quality, and determination of which waterbodies already benefit from them will enable the direction of limited funding to sites of greatest environmental efficacy. DU developed a geometric ratioing technique to extract and differentiate water impoundments from natural flood inundation cost-effectively using satellite imagery. Using this technique, DU acquired and analyzed satellite imagery going back 15 years, prior to widespread implementation of water impoundment practices and enrollment of significant acreages in reforestation cost-sharing programs. The dataset "Managed Water 87-05" depicts the sites where impounded water has been observed at least once over the period from the winter of 1987-88 and the winter of 2004-05. Though a field may not necessarily be flooded on an annual basis, the fact that it has been observed with impounded water suggests water management capacity exists on site.
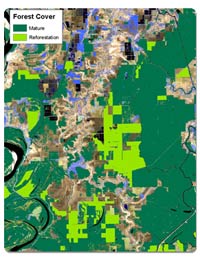
Because forest cover plays such an important role in retaining sediment and nutrients and preventing erosion, an understanding of the current extent of forest cover and reforestation activities is vital to thorough water quality planning. Even though the clearing of the LMAV's forests generally occurred from the highest and driest sites to lowest and wettest, there still exist numerous highly flood prone areas and scouring riparian zones that lack soil stabilizing vegetation. Research shows that bottomland hardwoods remove and retain substantial sediment loads from overbank flood waters (Kleiss, 1996). In order to understand better where forested blocks and riparian buffers exist, DU analysts incorporated in STREAM a forest cover dataset for the entire LMAV (http://southern.ducks.org/ForestChangeDetection.php). Data were initially developed from 2001 Landsat 7 ETM+ imagery, classified to isolate forest cover, which was labeled as Mature. These data were augmented with WRP easement boundaries current as of 2004 enrollments, labeled as Reforestation. The Forest Cover data and stream networks allow evaluation of the use of vegetated stream buffers as best management practices and identify areas where these practices should be implemented or expanded.
 Hydrology
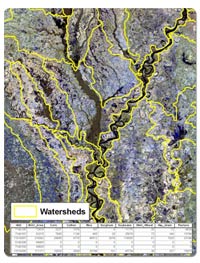
Central to watershed-scale planning for water quality enhancement is an understanding of hydrologic relationships within and across watersheds. DU compiled a series of useful datasets to help users better understand the hydrology of these systems. USGS 8 digit HUC's were incorporated to provide a region-wide coverage of drainage basins. 11 digit HUC equivalents were acquired for Mississippi and Louisiana. http://water.usgs.gov/GIS/huc.html National Hydrography Dataset water bodies were included for reference. NHD stream reaches were incorporated to elucidate drainage networks. http://nhd.usgs.gov/
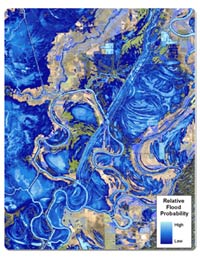 Hydrologic functionality, namely the flooding regime, stands as likely the single most important factor in the ecological integrity of wetland ecosystems (Mitsch and Gosselink, 2000). Though the majority of the LMAV historically functioned as a floodplain system, the widespread hydrologic engineering of the 20th Century drastically altered natural hydrology, thereby producing a much smaller active floodplain at present day. Because understanding hydroperiod for sites throughout the region is paramount to the potential effectiveness of wetland restoration/ rehabilitation activities and water quality planning, the need for spatially explicit, medium to high resolution flood probability data became apparent. Revegetation of denuded flood zones contributes substantially to slowing down flood waters, thereby causing sediment to fall out and be retained. Vegetation can take up excess nutrient loads, and root structures help stabilize floodplain soils, thereby preventing additional erosion. DU GIS specialists, with support from the USDA Forest Service and the LMVJV office, completed a Relative Flood Probability Dataset, which provides an analytical tool to understand the current extent and relative frequency of the high frequency floodplain. The Relative Flood Frequency dataset arose as a synthesis of river gage data analysis and the classification of satellite imagery. The gage data were used to determine appropriate dates for each individual stream segment at flood stages of interest. Dates were correlated with available Landsat satellite imagery, which was used to document flood extents. Through the combined efforts of Ducks Unlimited and the Lower Mississippi Valley Joint Venture Office, Period of Record (POR) river gage data were acquired from the various US Army Corps of Engineers districts that comprise the Lower Mississippi Alluvial Valley: New Orleans, Vicksburg, Memphis, and Little Rock. Satellite scenes were selected ranging back to 1982 based upon a frequency analysis of flood events from the river gage data. Water features were extracted from the imagery and compiled to reflect the percentage of times out of all scenes that each pixel was observed inundated. The analysis revealed that despite the high level of hydrologic engineering within the LMAV, there still exists a significant active floodplain. Of the 23 years worth of flood events captured via satellite imagery, approximately 11.9 million acres or 48% of the LMAV was observed to flood on at least one point in time or another. Of those 11.9 million acres, approximately 2.1 million were observed to flood during every satellite observation, suggesting permanent winter water (see the discussion under Managed Water 87-05). Separating out these annually present winter water acres leaves nearly 9.8 million observed acres, or nearly 40% of the region, that are assumed to be intermittently flooded.
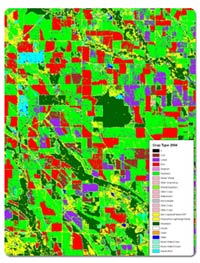 An understanding of landuse/landcover is integral to water quality planning and evaluations. Because of differences in cultivation practices, crop types are particularly relevant. National Agriculture Statistics Service 2004 crop type data were acquired for Arkansas, Mississippi, and Missouri. The NASS datasets are created annually through a multi-date classification of satellite imagery. Full metadata can be found at http://www.nass.usda.gov/research/Cropland/metadata/meta.htm. Because the primary purpose of the NASS data is mapping crop types, users should refer to the ancillary Forest Cover and Aquaculture datasets to assess the most accurate extent of the landuse practices. Additionally crop type acreage summaries are included in the attributes of the 8-digit HUC watershed dataset.
Because of the prominence of catfish aquaculture in the LMAV and the incomplete coverage of this cover type in the NASS data, DU developed a current, as of January 2005, coverage of catfish aquaculture for the entire LMAV. Aquaculture features were digitized based on well defined and visible levees and cross referenced with the 2004 NASS Crop Type Data. Units had to be consistent with NASS data to be included in the aquaculture database. If an area had well defined levees and NASS had that area defined as something other than aquaculture or water it was omitted from the aquaculture database. For the state of Louisiana there were no available NASS data to reference. Therefore, only those aquaculture units that were obviously catfish ponds were included in this database.
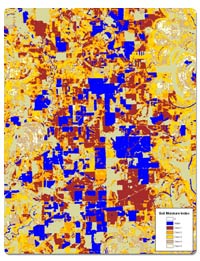
Besides landcover/croptype, several other site-specific factors influence soil erosion and run-off rates. Particularly notable are slope and soil characteristics as determinant factors in erodability. DU calculated slope for the entire LMAV using the USGS National Elevation Dataset. Prior to calculating slope, all NED panels for the entire LMAV were mosaiced together and all sinks were filled to minimize data anomalies. Slope values are represented in percentages. DU collaborated with the USDA Forest Service to create a Soil Moisture Index (SMI) for the LMAV. Precise in situ measurements of soil moisture are difficult to acquire for large geographic areas such as the LMAV. The conservation partners that have interests in the LMAV realize that information about soil characteristics is vital to determining optimal locations for reforestation and wetland restoration. The SMI was created for use as a surrogate for digital hydric soils data for the LMAV using Landsat satellite imagery acquired during the drought conditions of winter 1999. Using winter drought imagery ensured a more accurate evaluation of soil moisture-retention capacity by minimizing the effects of vegetation in agricultural fields and surface water in satellite imagery analysis. The imagery was classified using an unsupervised classification technique into five soil moisture categories and an open water class. SMI values were only determined for bare soil sites; all sites with ground cover were not assigned a class value. On the ground accuracy assessment affirmed distinct relationships between surface soil moisture, sinks, and existing hydric/non-hydric soil maps. Though these data were developed for evaluating soils capacity to retain water for wetland restoration planning, other characteristics of soils can also be inferred from SMI values. For example, high SMI soils are likely to be of smallest particle sizes and easiest transportability.
Though Project STREAM was designed as a planning tool for management of Non-point Source pollutants of agricultural derivation, also included as an ancillary resource are permitted point source effluent sites. The National Permitted Discharge Elimination System (NPDES) database is a repository of information on the location and type of federally permitted waste discharge sites that release effluent into waterways. The US Environmental Protection Service, in coordination with state environmental quality agencies, maintains this database. For further information on NPDES program resources, see http://cfpub.epa.gov/npdes.
Finally, the suite of tools compiled and developed for the DSS were packaged in an Internet Map Server (IMS) site to ensure transferability of the system via the internet to the regional water quality community. A more traditional project delivery strategy, such as a stand-alone application or a set of GIS data layers, severely limits the pool of potential users to those with GIS capacities. By web-enabling the DSS in a user-friendly IMS system such as STREAM, all users with internet access will have much of the analytical power of a GIS without having to acquire GIS training. Designing a landscape that allows large-scale restoration efforts to occur in areas that maximize ecological benefits is vital to the conservation partnerships that operate in the LMAV. It is toward this end that DU developed these datasets and decision support system. Project STREAM provides an invaluable and unique toolset for assessing need and site potential for water quality enhancement work and will strengthen the conservation community's efforts in this ecologically sensitive region. Placing these powerful geographic analysis tools in the hands of regional water quality professionals will facilitate large-scale evaluation of factors impacting water quality and allow agencies to better maximize water quality benefits for each dollar invested in non-point source treatment programs and other conservation efforts.
Carpenter, D. J. and S. M. Carpenter (1983). "Modeling Inland Water Quality Using Landsat Data," Remote Sensing of Environment 13: 345-352.
Kleiss, B.A.(1996). "Sediment Retention in a Bottomland Hardwood Wetland in Eastern Arkansas," Wetlands 16, n3: 321-333.
Maul, J.D. and C.M. Cooper (2000). "Water Quality of Seasonally Flooded Agricultural Fields in Mississippi, USA," Agriculture, Ecosystems and Environment 81: 171-178.
Messina, M. and W. Conner (1998). Southern Forested Wetlands: Ecology and Management. Lewis Publishers, Boca Raton, FL-USA.
Mitsch, W. and J. Gosselink (2000). Wetlands. John Wiley and Sons, Inc., New York, NY-USA.
Ritchie, J.C., F.R. Schiebe, and C.M. Cooper (1983). "Spectral Measurements of Surface Suspended Matter in an Oxbow Lake in the Lower Mississippi Valley," Journal of Freshwater Ecology 2: 175-181.
Willis, T (2004). "Mississippi Partners Winter Water Management Project," Mississippi 319(h)/ Unified WatershedAssessment Project Final Report. Contract number MDEQ00-01-FP-0001DU, Mississippi Dept. ofEnvironmental Quality, Jackson, MS-USA.
Ducks Unlimited uses cookies to enhance your browsing experience, optimize site functionality, analyze traffic, and deliver personalized advertising through third parties. By continuing to use this site, you agree to our use of cookies. View Privacy Policy